Call Metrics
Detailed breakdown of call analytics, agent performance, and trends.
Call Metrics
Dive deep into your call data with detailed metrics and breakdowns.
Date Range Filtering
Use the date picker at the top of the dashboard to filter metrics:
- Today, Yesterday, Last 7 Days, Last 30 Days
- Custom Range — select specific start and end dates
All charts and KPIs update immediately when you change the date range.
app.kingcaller.ai
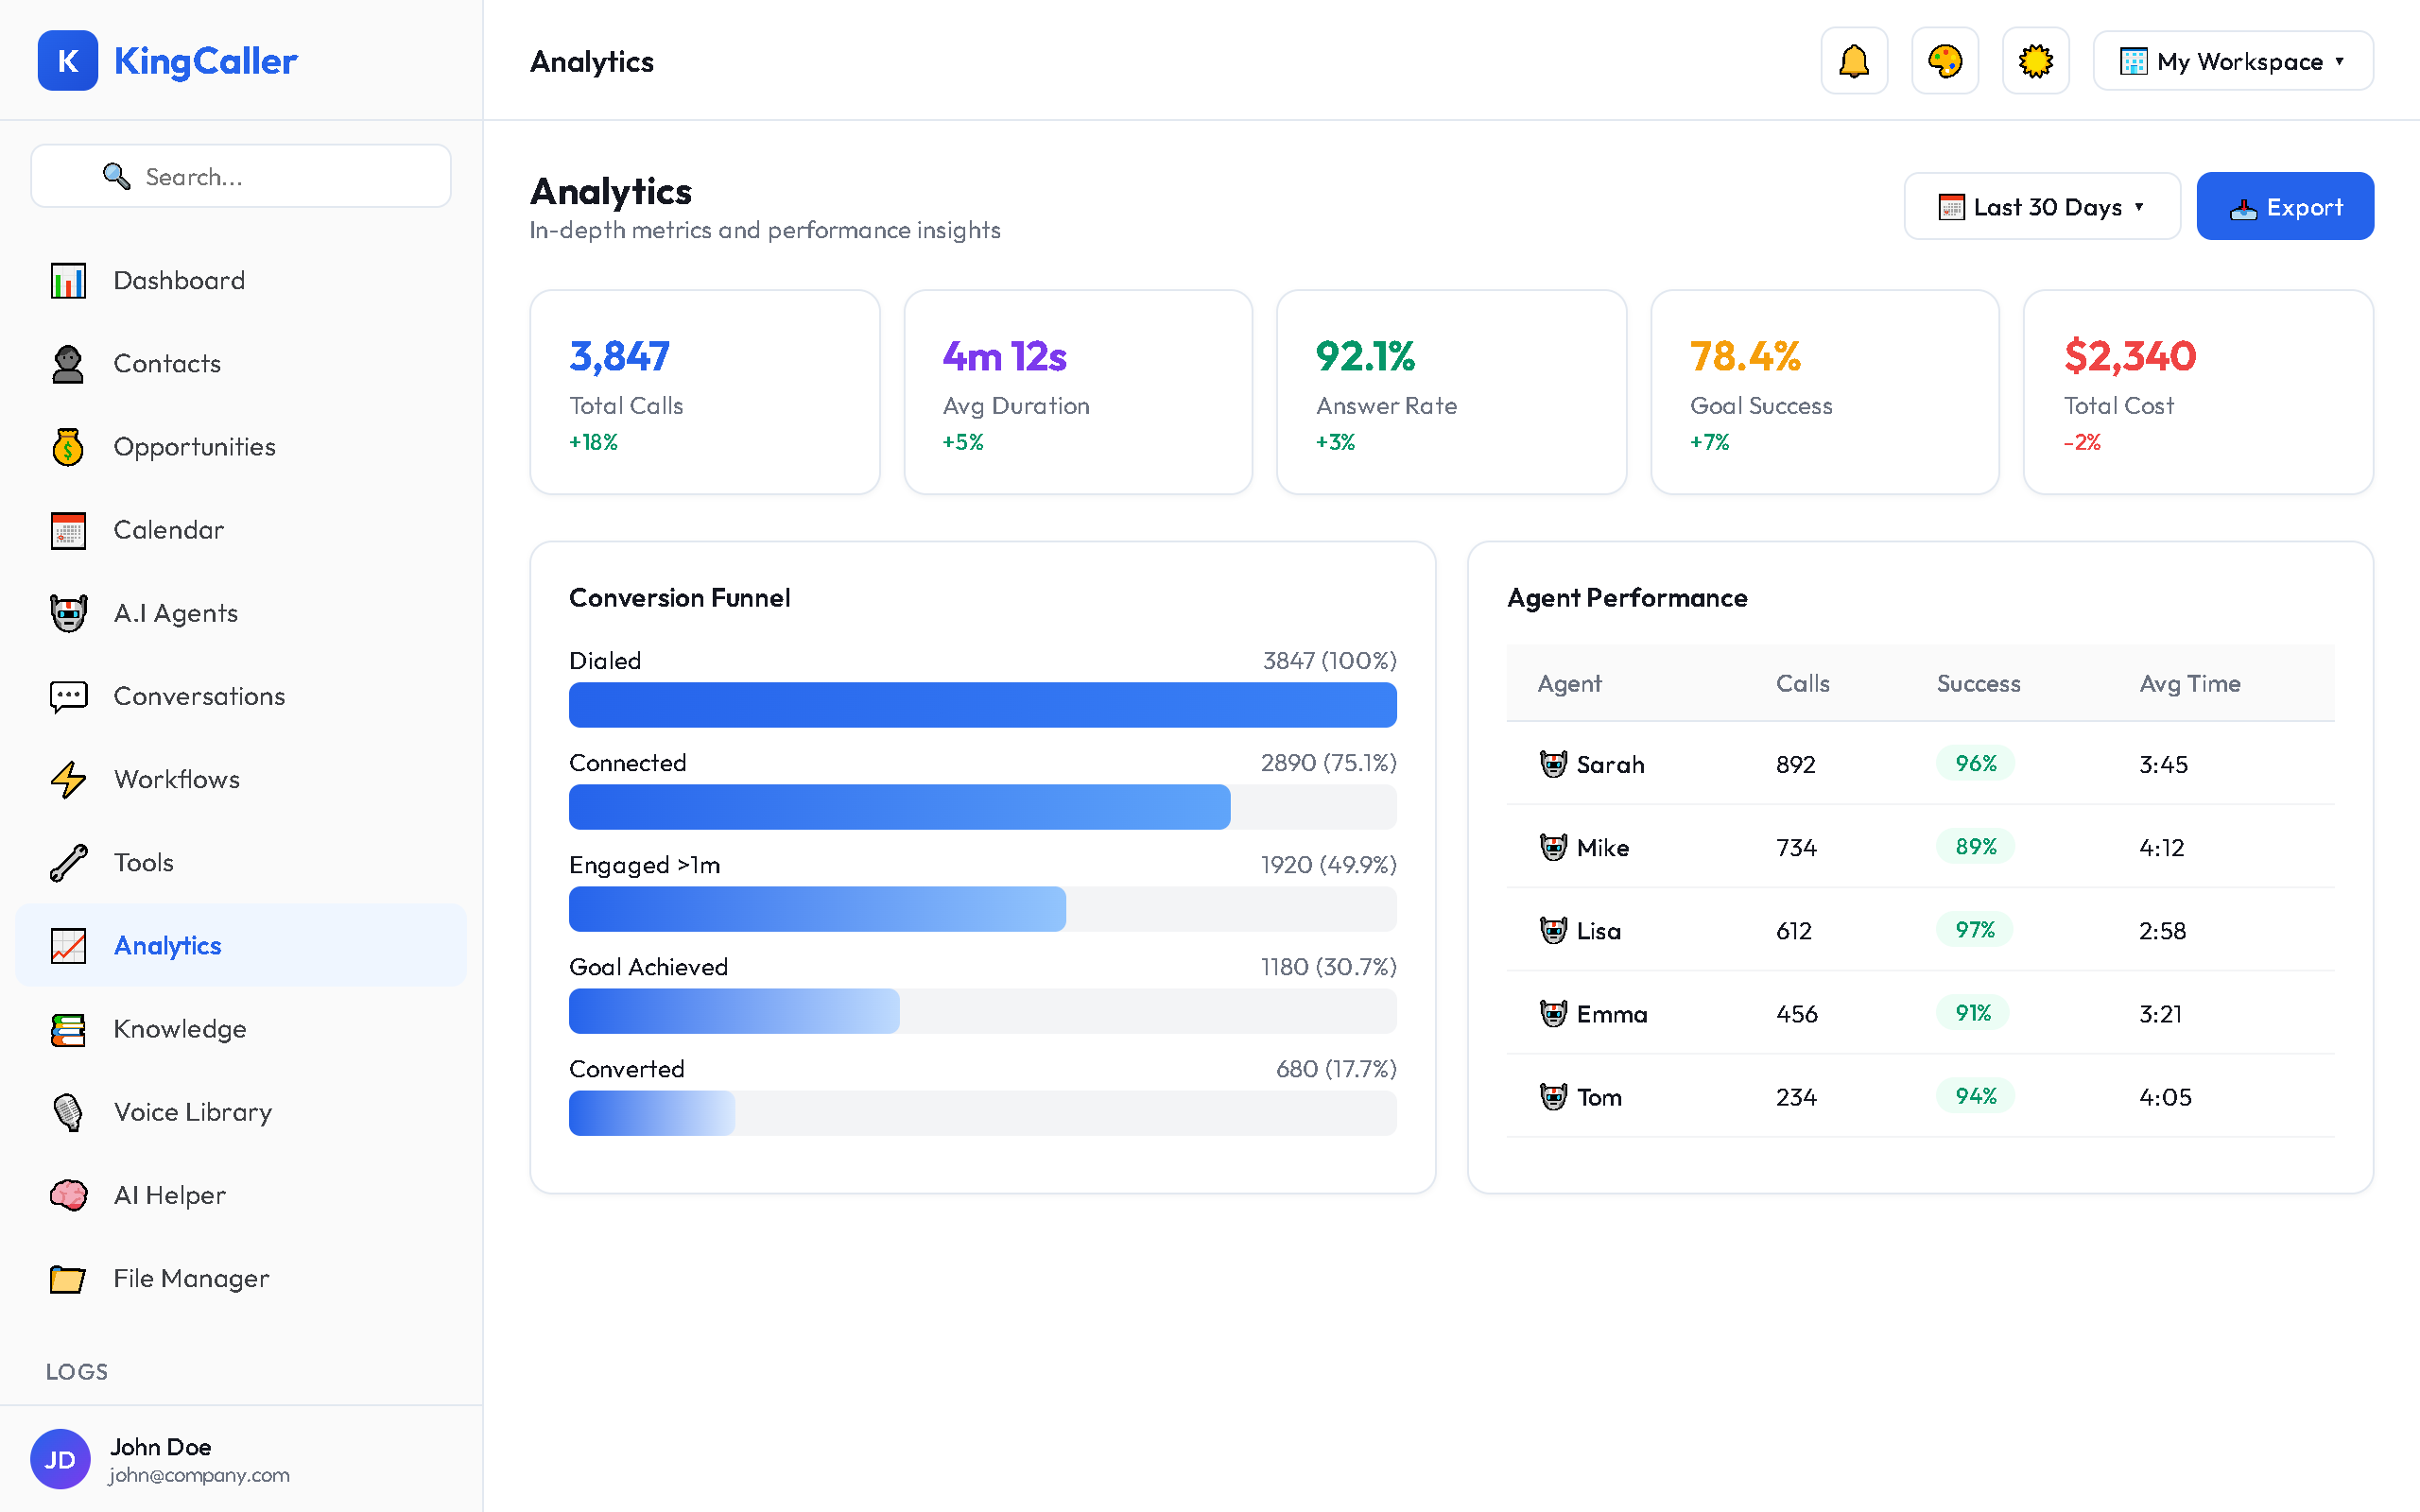
Agent Performance Table
Compare agents side-by-side:
| Column | Description |
|---|---|
| Agent Name | The AI agent |
| Total Calls | Number of calls handled |
| Success Rate | % of calls meeting their goal |
| Avg Duration | Mean call length |
| Answer Rate | % answered (outbound only) |
| Transfers | Number of transfers to humans |
| Customer Satisfaction | Avg rating (if post-call survey enabled) |
Click any agent row to see that agent's detailed breakdown.
Call Volume Analysis
The call volume chart shows:
- Inbound vs Outbound call split
- Daily/Weekly/Monthly time groupings
- Trend lines — see if call volume is growing
Conversion Funnel
For outbound campaigns, track the conversion funnel:
app.kingcaller.ai
- Dialed — total calls attempted
- Connected — calls that were answered
- Engaged — calls where conversation lasted 30+ seconds
- Qualified — calls where the lead was qualified
- Converted — calls achieving the campaign goal
Each stage shows the count and drop-off percentage from the previous stage.
Call Outcomes
| Outcome | Description |
|---|---|
| Completed | Call ended naturally |
| Transferred | Caller was transferred to a human |
| Voicemail | Call went to voicemail |
| Abandoned | Caller hung up early |
| Failed | Technical error or timeout |