Widget Library
Browse, search, and add widgets to your dashboard from the built-in widget library.
Widget Library
The Widget Library is your catalog of available dashboard components. Add charts, KPI cards, tables, and more to build the perfect monitoring view.
Accessing the Widget Library
- Click Edit Layout in the top-right of the Dashboard
- Click + Add Widget to open the library
- Browse by category or search by name
- Click a widget to add it to your dashboard
app.kingcaller.ai
2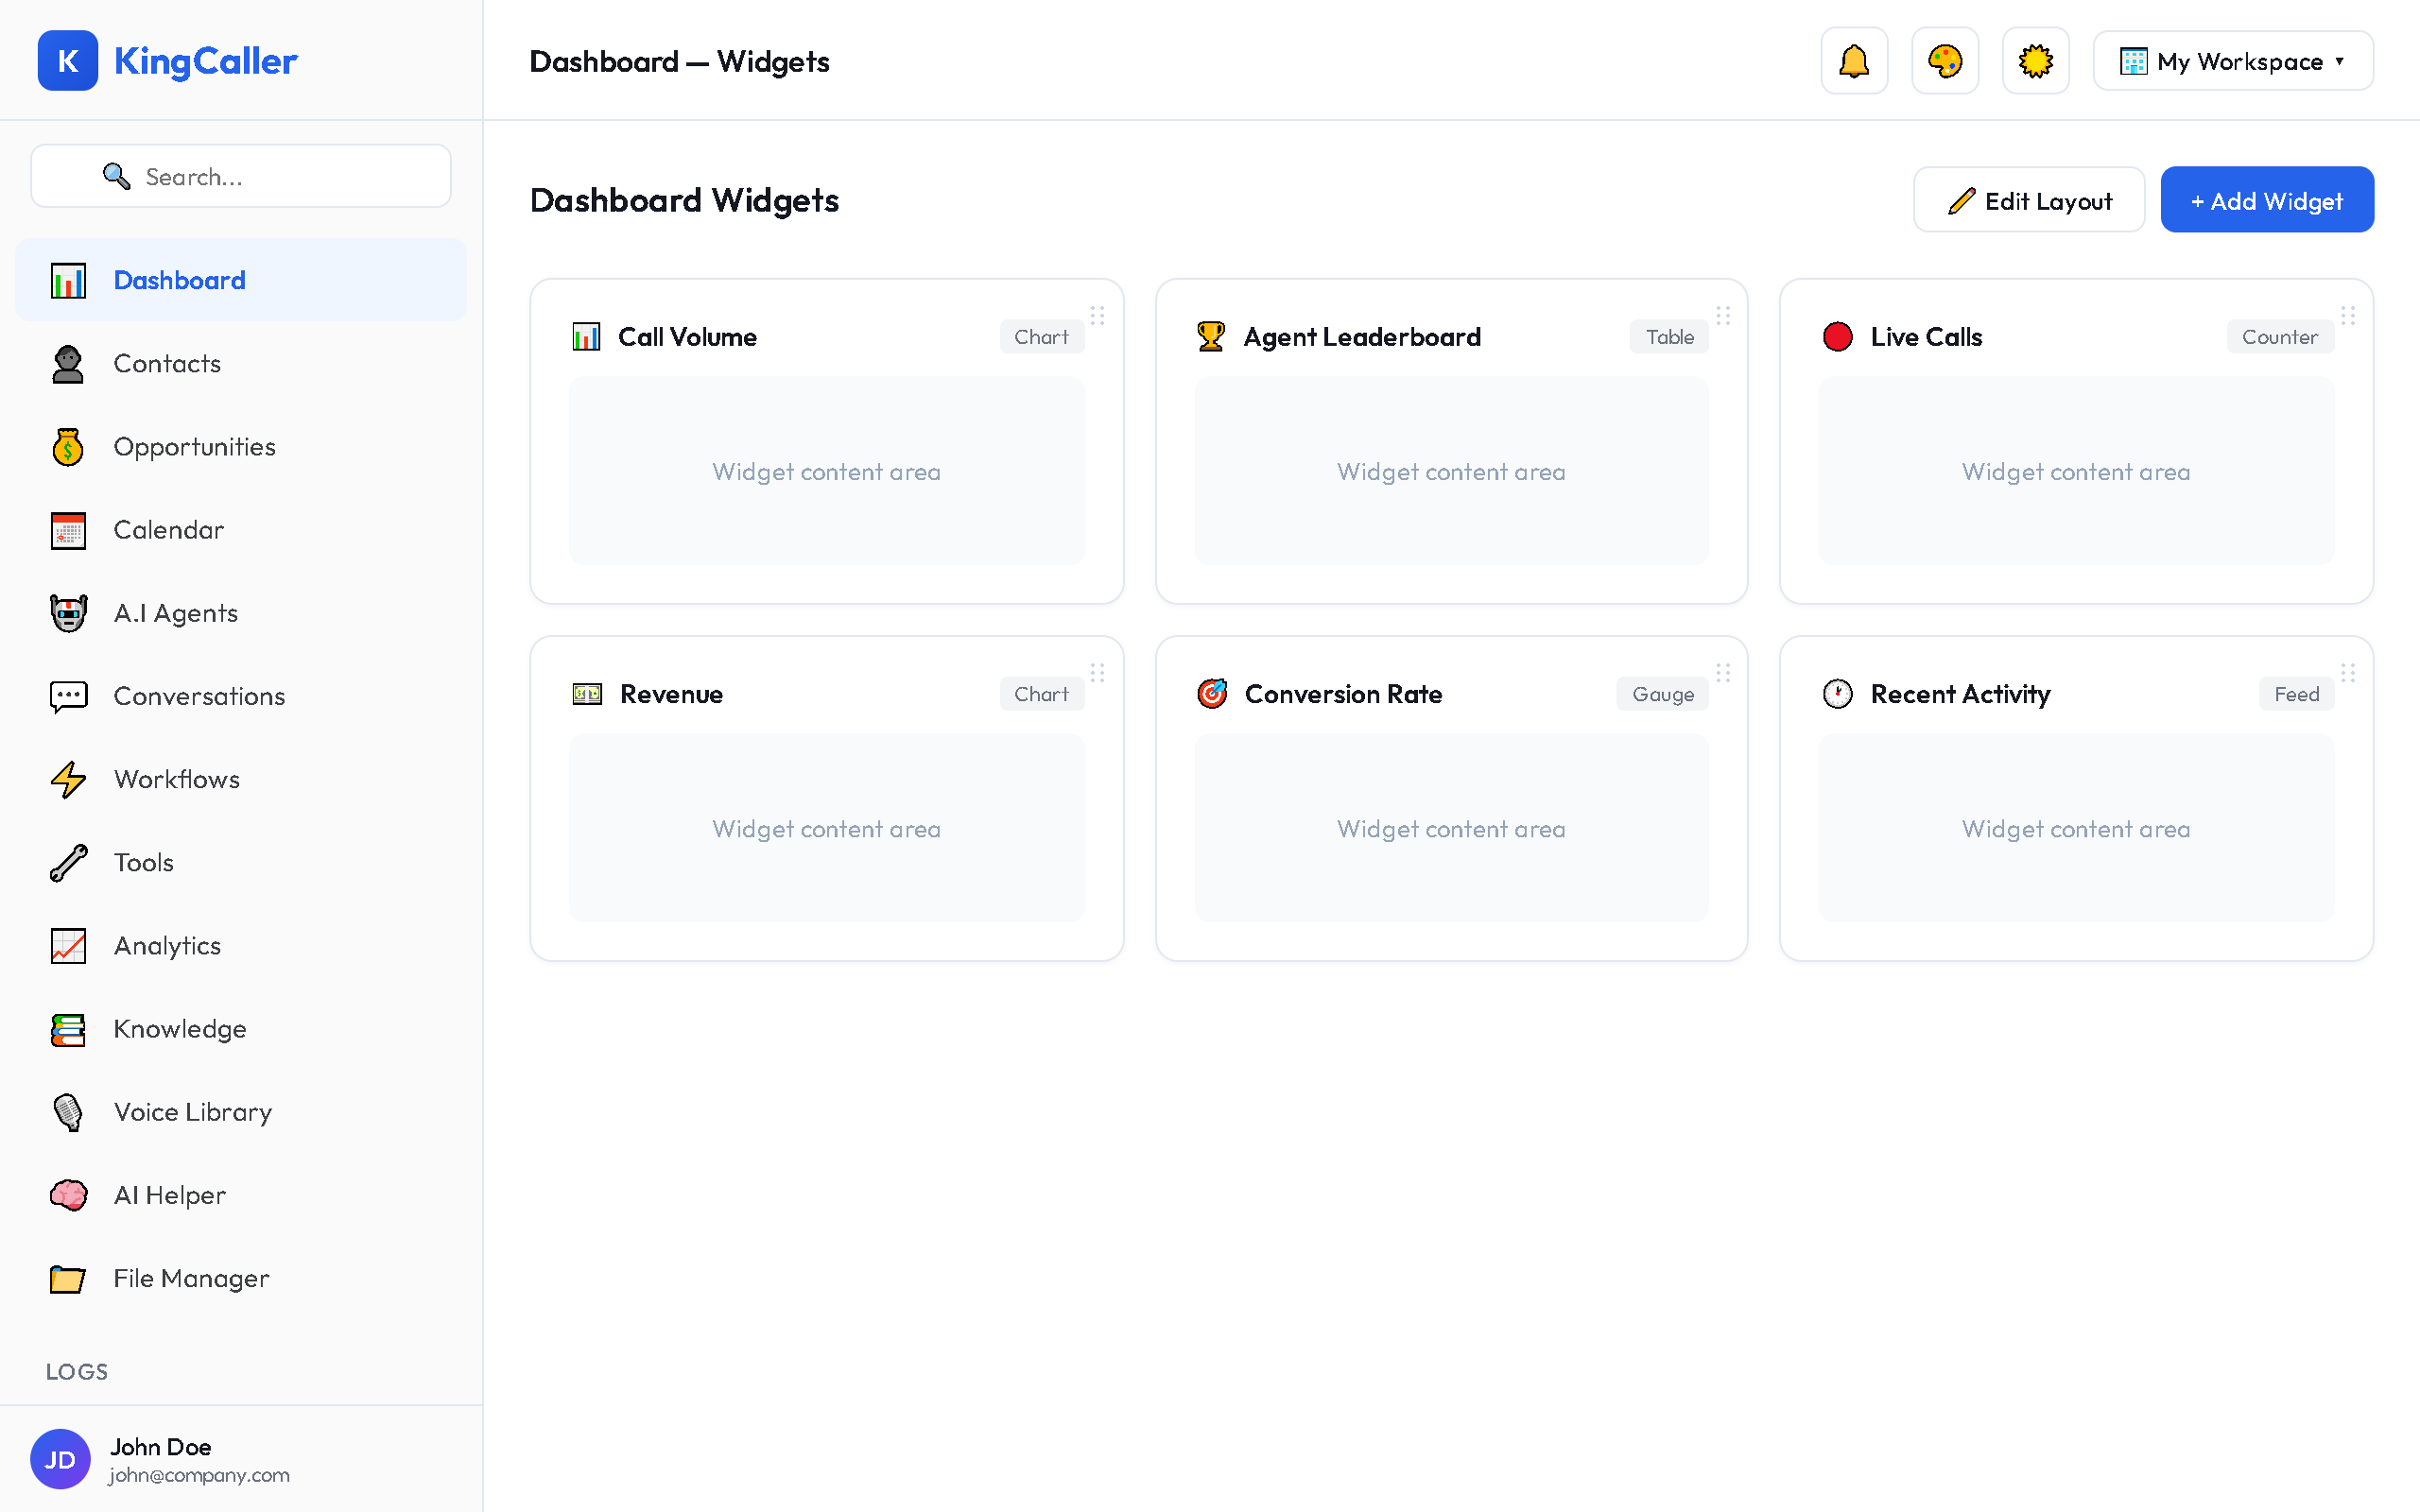
Widget Categories
| Category | Widgets Included |
|---|---|
| KPIs | Total Calls, Success Rate, Avg Duration, Active Agents, Cost |
| Charts | Call Volume Trends, Agent Performance, Conversion Funnel |
| Tables | Recent Calls, Top Agents, Call Breakdown |
| Custom | Create your own charts with custom data queries |
Managing Widgets
Enable / Disable
Toggle widgets on or off without deleting them. Disabled widgets are hidden from the dashboard but retain their position.
Custom Charts
- Click + Create Custom Chart in the library
- Select your data source (calls, agents, contacts)
- Choose chart type (line, bar, pie, area)
- Configure axes and filters
- Name your chart and save
app.kingcaller.ai
3Widget Settings
Each widget has a ⚙️ settings icon that lets you configure:
- Data range — override the dashboard's global date filter
- Refresh interval — how often data updates
- Display options — labels, legends, colors