Dashboard Overview
Your customizable widget-based analytics dashboard with drag-and-drop layout, KPI cards, and real-time metrics.
Dashboard
The Dashboard is your real-time command center. It displays key performance indicators, charts, and metrics through a fully customizable widget-based layout that you can drag, drop, and resize to match your workflow.
Key Features
- Multiple dashboards — create different dashboards for different purposes
- Widget library — browse and enable widgets by category
- Drag-and-drop layout — arrange widgets exactly where you want them
- Resizable widgets — make charts bigger or smaller
- Date range filtering — view data for 7 days, 30 days, or custom ranges
- Export data — download as CSV or JSON
app.kingcaller.ai
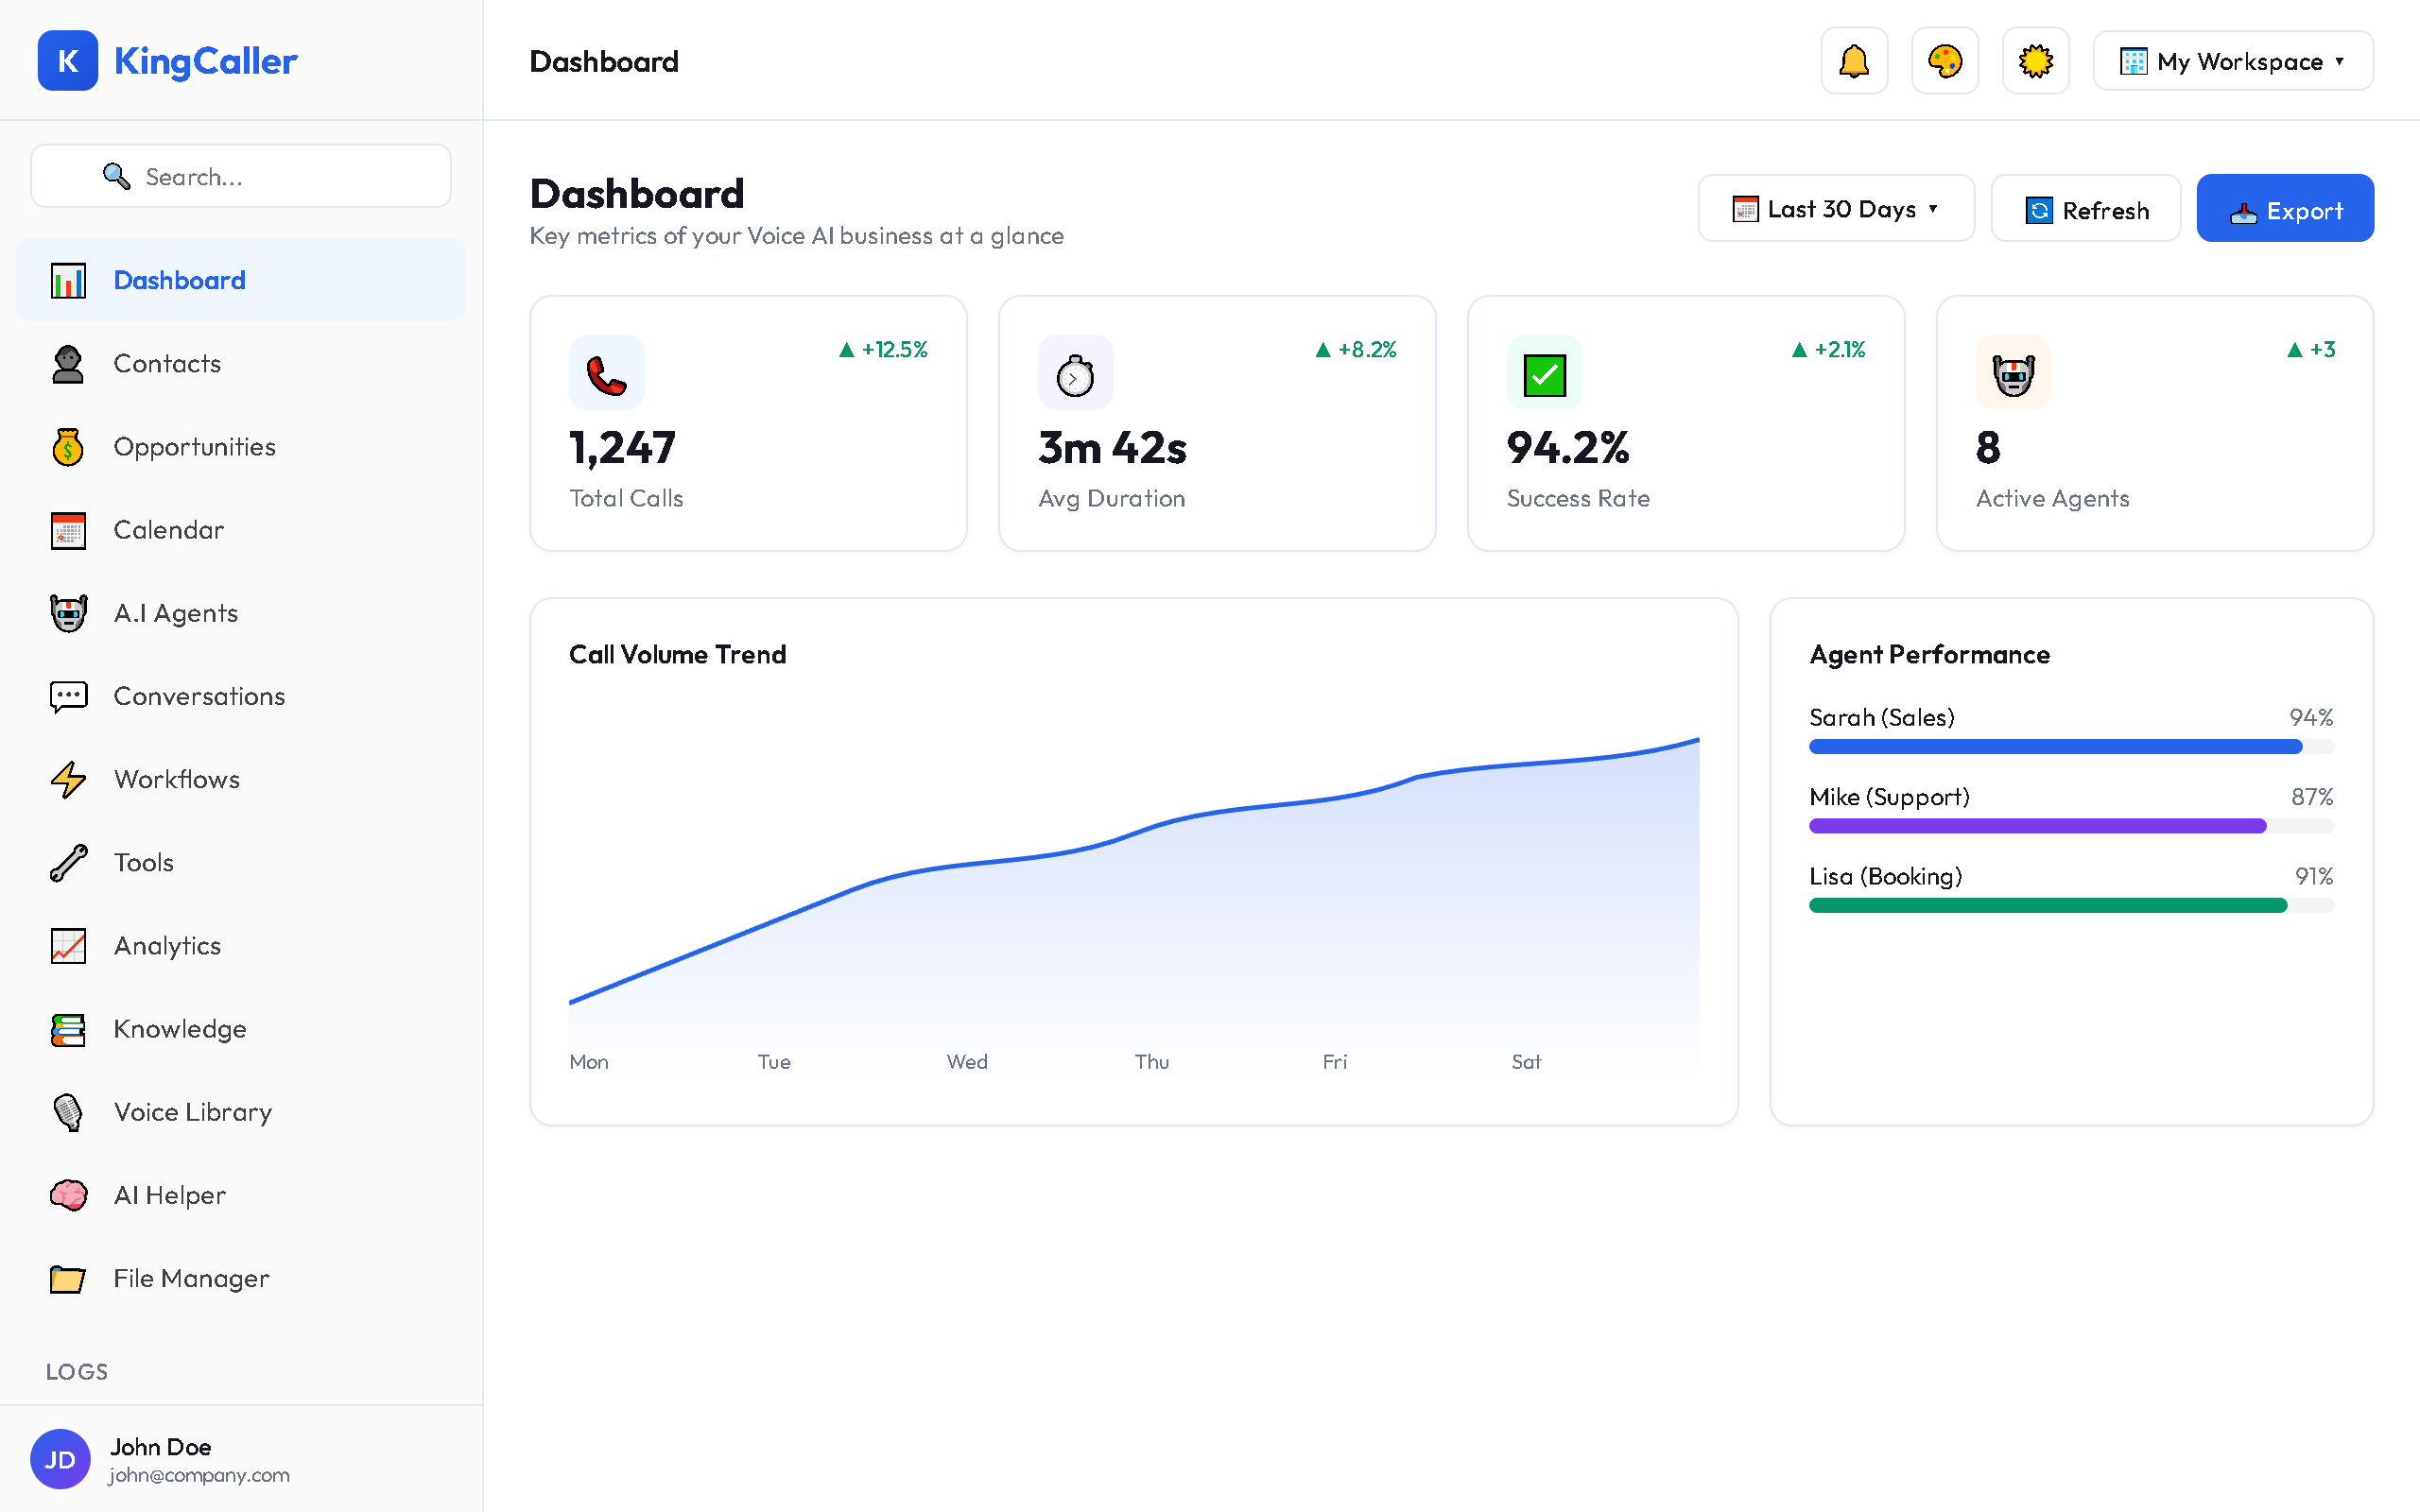
Default KPI Cards
When you first open the Dashboard, you'll see these key metrics:
| Metric | What It Shows |
|---|---|
| Total Calls | All calls in the selected period |
| Average Duration | Mean call length |
| Success Rate | Percentage of successful calls |
| Active Agents | Currently running AI agents |
| Answer Rate | Calls answered vs total |
| Total Cost | Spending in the period |
Quick Links
- Widget Library — Browse and add widgets to your dashboard
- Customization — Edit layout, create dashboards, export data